Fashion Market Segmentation and Analysis with Trendalytics
Published:
Summary
For our capstone, we were paired with Trendalytics, an NYC-based company primarily servicing apparel retailers across high-end and discount markets. Trendalytics’ objective is to confidently offer predictive analysis for all different aspects that make up the retailer world. The company helps users optimize their inventory investment decisions by providing them with the required analytics they need to buy into the right products, at the right price, and at the right time. From planners (those who are in charge of deciding the timing for which trends and designs should be available) to buyers (those who are tasked with determining how aggressively a retailer should stock up inventory for specific trends), Trendalytics aims to solve three major problems facing retailers:
- What do I buy?
- How much do I buy?
- When do I buy?
The main scope of this capstone project is to efficiently gain an understanding of retailer behaviors and establish a methodology to allow for market segmentation. Market segmentation can be defined as a way to classify retailers.
Report can be found here, poster here and relevant code can be found in this GitHub repo.
Data and Methods
The data provided is comprised of three different sets: search data, market data, and social data. The search data is comprised of Google Trends corresponding to popularity metrics on 30,000 tracked terms. This includes terms such as neon, highwaisted, cold-shoulder and their relative search counts over as a time series, starting from 2014 to the present. The market data is a combination of both Trendalytics’ platform and specifically programmed web crawlers that aggregate data regarding product inventory and price from major apparel e-commerce websites.
Generating a concise methodology for market segmentation required a substantial amount of data engineering and feature engineering. Our group established a clear timeframe of data we were to use and which fashion categories and trends we will focus on. We looked at data from 2017 - 2019, specifically women’s clothing in the US and analyzing the trends of seven terms: neon, paper bag waist, high waisted jeans, animal print, open shoulder, puff sleeve, and black cargo pants.
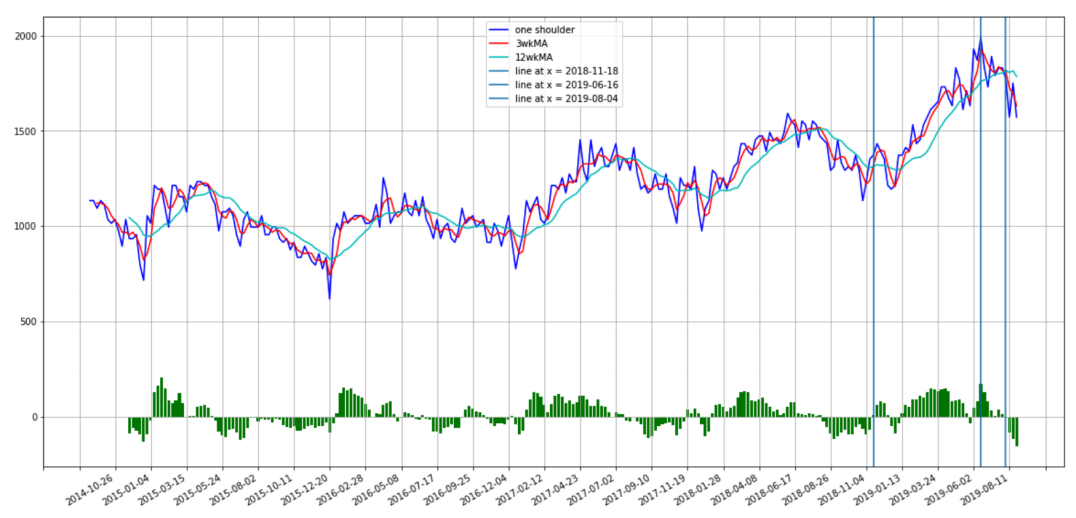
For feature engineering, we developed a methodology to define t0, the moment a term is regarded as “trending”. Engineering t0 essentially involves scanning the search volume time series, trying to locate a period where the slopes of search volume are positive most of the time and to a meaningful degree. We proceeded with a momentum signal methodology, an approach commonly used in finance that is highly transferable to this problem. We took the difference between 3 weeks (short-term) and 12 weeks (long-term) moving averages and then picked the week with the highest positive difference as the peak. We define t0 to be the time when the negative momentum period occurring just prior lasts longer than 8 weeks.
Next we define two more features using t0:
- Retailer Stocking Delay: the number of weeks between trend t0 date and retailer’s t0 date for that trend. This value corresponds to how long a retailer took in weeks to “pick up” and increase their stock of this trend.
- Retailer Stocking Aggression: the (log) difference in slope between the maximum slope of the trend for a retailer and the maximum slope of the trend search data. This value is a proxy for how aggressively a retailer increased their stock of a particular trend in response to a surge in the trend’s popularity.
Thus, for each trend, we plot all the retailers for the selected trends, where they fall in the feature space, and colored their corresponding market index labels as provided by Trendalytics.
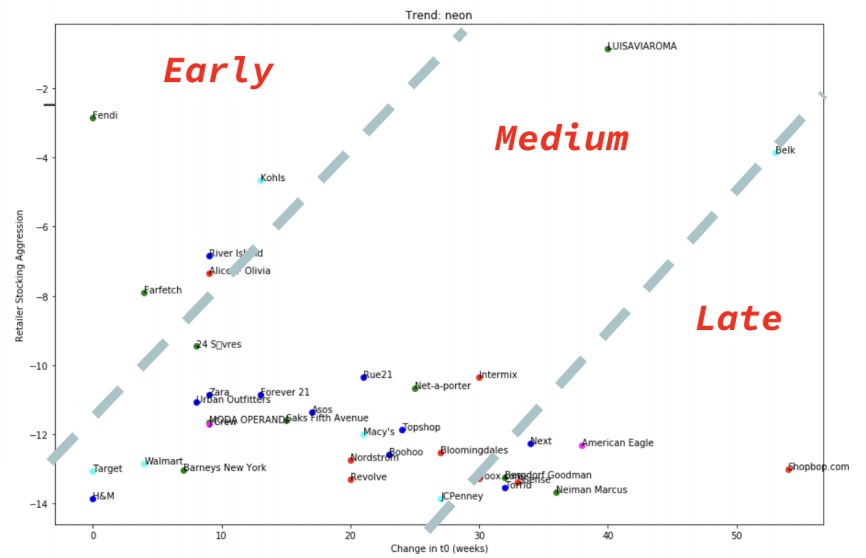
The goal of this landscape is to visualize if the retailers labeled under the same Market Index exhibit similar behaviors (indicated by close positions). A retailer located farther right in the feature space indicates a slower response time to the trend. A retailer located higher up indicates that it stocks its inventory more aggressively in response to a trend’s demand.
We cluster the retailers using the average stocking aggression and average retailer stocking delay over the selected trends for all retailers. The average is taken to create a single metric to represent the retailer during clustering. The clustering algorithm we use is KMeans because, being a distance-based algorithm, it assigns the retailers early, medium, or late trend adoption labels according to the natural groupings of the data.
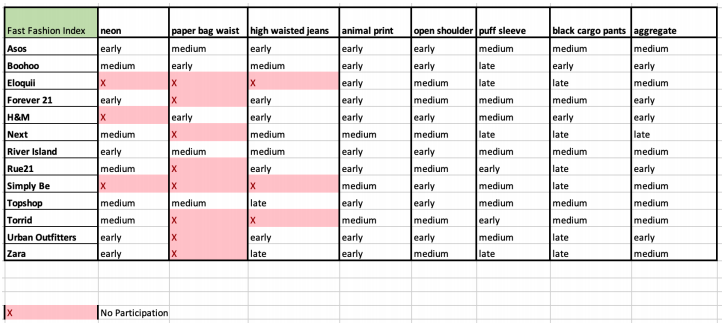
To summarize the outcome of our feature engineering and clustering, we provide a Score Card that succinctly captures all trend behavior labels and provides a comparison across retailers. The Score Card is intended to help retailers understand:
- How many of the selected trends are they active in, relative to their competitors?
- If they participate in those trends, what is the speed at which they ”catch on” to the trends?
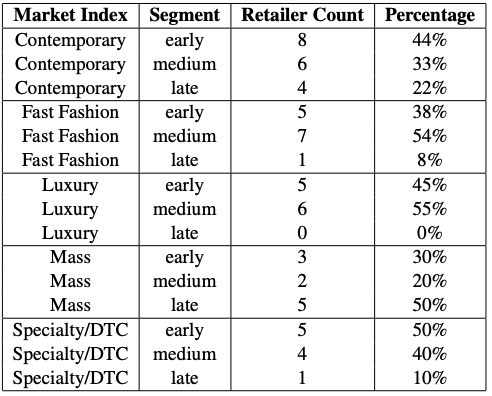
A consolidated view of trend adoption segment counts and percentages for all retailers within a given Market Index given below.